It is not an 'Oh No', I've got everything wrong or forgotten some
critical step - it is that I'm only at the start of the journey and there is
a long way to go. I had thought/hoped that a relatively quick project
would yield results I could use straight away. I have taken over 1,000
exposures on this project (a lot of which I have not used), but I need
real-life examples to help me complete and refine my suggested method.
A Simplified System
- Three Textured Zones
I am not experienced enough to recognise Ansel's 10 zones, especially in
colour. When I started the
Learning from the Masters project I analysed paintings in 5 tonal bands
and I think this is probable a good number to start with - Black, Shadow,
Mid-tone, Highlight and White. These are effectively 0, III, V, VII
and IX.
These Textured-Zones do not equate to 'n' f-stops, they vary with the 'film'
characteristics and the contrast range required from the scene, how I
want to view the photograph and its size. I believe the Zone System's
basic concept that the system is based on the artistic premise is the
key to using it in the digital world.
We are not able to change the development times of the digital 'film' as
they use to do with real film and so I can not see how the whole process of
the Zone system, post exposure, can be reproduced in this digital world.
However we can really go to town with our post-processing provided we
have the detail in the image in the first place.
That is easy in a low contrast subject, but with the current cameras we may
need at least 2 exposures to get all the detail we need when high contrast
is around.
Once we have identified the important zone and taken the photo, I then do
not see (at the moment) how further zone type analysis can help and think
that free-hand post-processing takes over.
- Exposure
My thoughts are to keep things simple for the moment and use one camera set
up (as indicated before) for two 'film' types - jpg and nef. This is,
of course, only for serious photos!
I shall use the spot meter on the lightest detail area I want to capture and
dial in compensation for that. I also need to meter the darkest detail
area and see if the exposure will capture that as well, otherwise I will
need more exposures, offset for the shadow reading with it's corresponding
compensation.
This will be an ongoing learning exercise and so to make life easier, I
shall record the meter reading for high, grey and low areas by taking 3 spot
metered shots of them (as it costs nought). Then I can extract the
relevant information from the EXIF data when I get back home and use that
with the actual shot(s) taken to continue to learn.
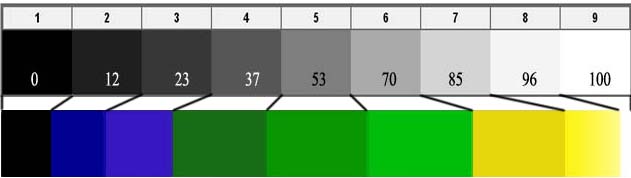
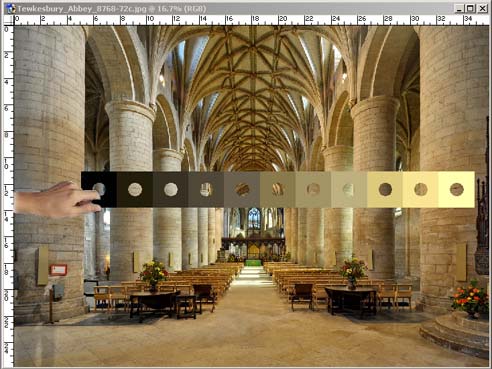
| Although all the camera have spot meters and one can easily zoom into
the relevant areas, the reading are not conveniently shown in EVs. The
opposite little chart will help me do the mental arithmetic required to
calculate the compensation settings and dynamic range.
The colours are just for me and are there to split up the chart with
my common settings for a lot of the photos I take. |
 |
From the experiments so far, a small exposure change can go from a small
amount of highlight detail to blown highlights very quickly. I think it
is going to take some time to learn where this 'cliff' is and it will be
different for each 'film'. Also there is a thought that for more linear
response, it may be necessary to dial in at least -0.3 ev compensation.
I shall have to check this out. - Analysis
For each scene I have taken, I will have 4 exposures - the actual scene
and 3 spot readings. I also have the Exposure Ruler (for both my
'film's), which may need refining over time - and I can also learn how much
variation there is per Textured-Zone.
| I will construct some PS Actions so that one can view the images in
a number of different tonal bands - for instance - Exposure Rulers, the
11 Ansel Zones (a la Koren) and a number of other Equal (perceptually
uniform)
Screen tone ones.
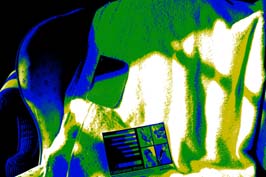
This example, of the towel test, is a 5 Equal Toned Screen Gradient
Map (you
can download it here and then load it into Photoshop) that can be
quickly and non-destructively added as an adjustment layer. If you
do not want coloured bands, then adding a regular b>w gradient map on
top of it will show them as grey-scales!
Note this should ideally be done in the Lab colour
space, as RGB conversion to (grey-scale) tones is not 100% accurate, but
that maybe being a little OTT. |
 |
Portraying the D700 jpg Exposure ruler in coloured (correctly placed on
the 0-100 (or 0-255) scale) bands is quite interesting (the top end band is
a little wrong!)
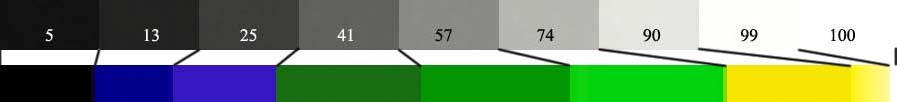
and similarly for Koren's 9 bands from the Zone System.
 If a gradient band is added as the top layer than one can watch the
effect of tone changes during post-processing. It has proved extremely
interesting watching 'zones' move during curving etc. and how they expand
and contract.
Using the Exposure Ruler gradient, one can easily see the different EV
areas of the image, so recording spot meter readings should not really be
necessary! I shall try and standardise on 50% scaled image for screen
viewing and an A3 print size to deduce the right sort of compensation on
spot meter reading. I have not looked into Noise in the shadow extraction in raw
images. It needs factoring in into the dynamic range of scenes.
Fill-in flash will be another interesting addition to problems of detail
capture.
PS. I've now added a Grey, or coloured, Zone Ruler to the
Colour Watcher tool that may
help one.
Footnote
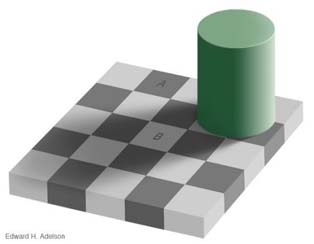
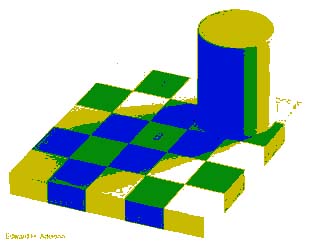
Finding mid-grey (zone V) may not always be easy - the classical image (below
left) has both A & B squares at the same value (as can be verified by the 5
colour band rendition on the right). Finding the lightest texture one
wants to preserve will make this decision much simpler.
As always, one learns by running with a project - how much of it is
useful and not the muttering of an ancient snapper remains to be seen.
I write these notes not only for my forgetful self, but in the hope that it
may give you an idea or two that may help in your photography. In
order to attempt to learn and answer questions, I keep searching the web.
Ming Thein just blows me away - if I could have a smidgen of his
ability, I would be happy. If you have not got/used Reindeer Graphics wide
histogram Photoshop plug-in (which includes Zones) it is still free to
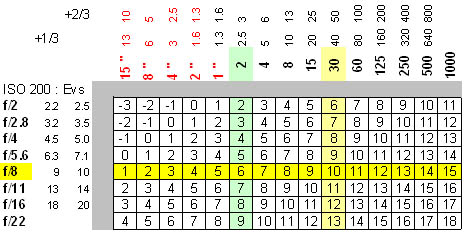
download on the web (you can see it on the HDR pages). Thought I
would include my Depth of Field chart (full frame 35mm, so it is backed up
on the web) as getting the right depth of field is important for subject
separation.
|
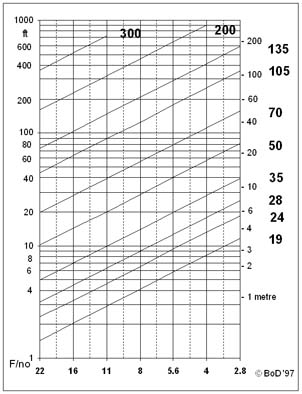 |
To find a Hyperfocal distance, read off the distance from the
intersection of the Lens slanting lines and the vertical F/no lines.
Focus the camera at that distance to get everything in focus from half
that distance to infinity.
For example the hyperfocal distance is 20 feet for a 50mm lens set at
F/11 and is 10 feet for a 35mm lens at F/11
If you have to interpolate, note that the vertical distance scale and
the Lens lines are not linearly spaced - so you will have to guess by
noting the spacing around them. |
Feb' 2013
|